My Store
Data Analysis & Visualization with Excel
Data Analysis & Visualization with Excel
Couldn't load pickup availability
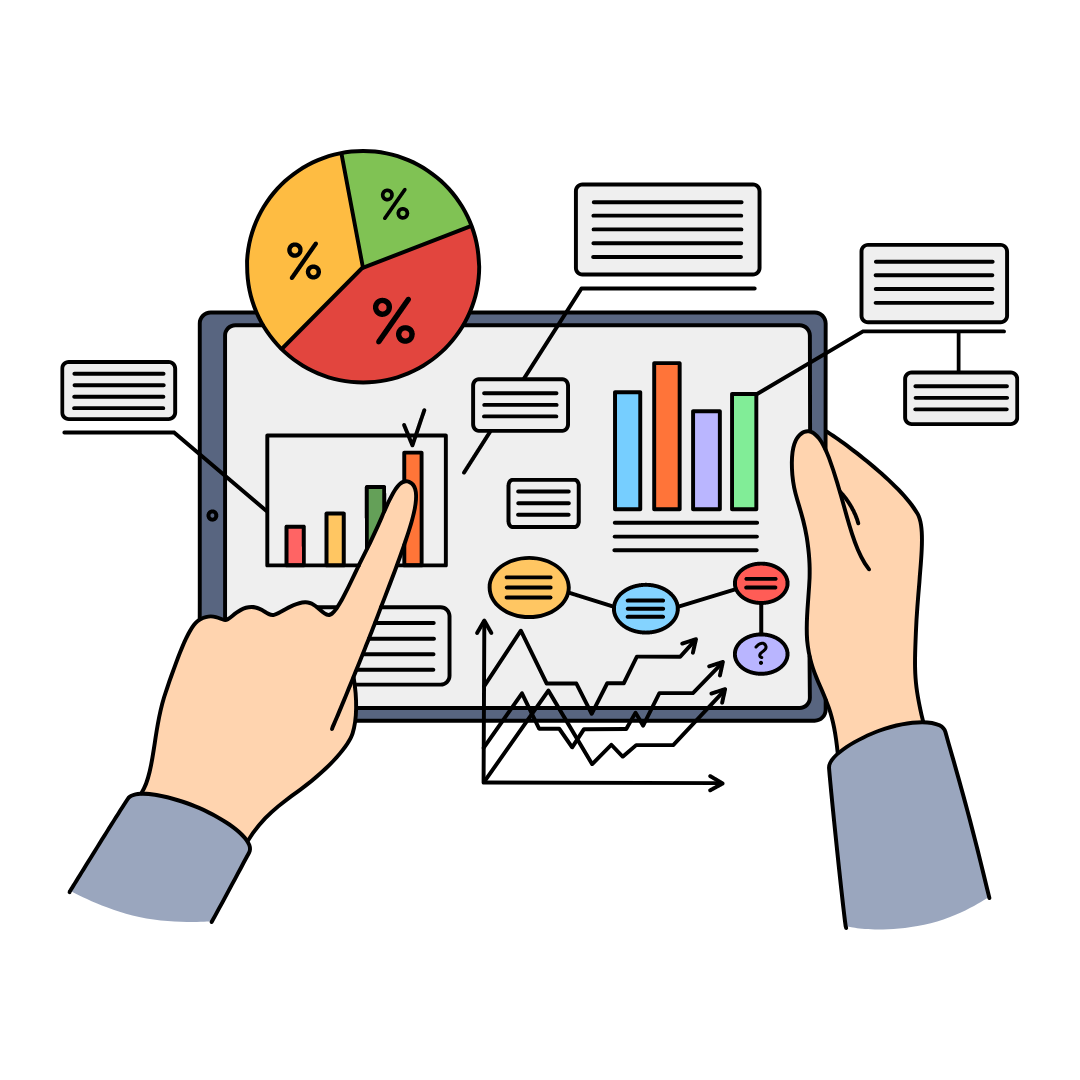
Data analysis and visualization skills are in high demand, enabling professionals to make data-driven decisions and communicate insights effectively. This course focuses on using Excel, one of the most ubiquitous tools for data analysis, to perform complex analyses and create compelling visualizations.
Course Description:
Unlock the power of data with our Data Analysis & Visualization with Excel course. Tailored for professionals eager to develop their analytical skills, this course teaches you how to leverage Excel to analyze data, spot trends, and tell stories visually. Transform raw data into actionable insights and compelling narratives to drive business decisions.
What This Course Includes:
- Introduction to data analysis concepts.
- Advanced Excel functions and formulas for data manipulation.
- Techniques for analyzing large datasets.
- Creating dynamic charts and graphs for visualization.
- Best practices for data presentation and reporting.
- Hands-on exercises and practical projects.
Each course is designed to not only meet the current demands of the job market but also to provide learners with skills that have a lasting impact on their careers. Customize these descriptions to fit the tone and style of your website, and feel free to add any additional details that highlight the unique benefits of your e-learning platform.
Share


